The new development of RNADisease.
1. Expand data sources and coverage of species, diseases and RNA types.
2. Add comprehensive expression analysis of mRNAs/miRNAs/lncRNAs from thousands of high-throughput sequencing data of cancers.
3. Provide four ncRNA-disease (miRNA/lncRNA/circRNA/piRNA) prediction tools.
4. Provide miRNA/lncRNA/circRNA-disease enrichment tools.
5. Add RNA modification information in disease.
6. Redesigned database based on the Django Model-View-Controller (MVC) framework.
Fig 1-1:
1. Main functions of the database are provided in menu bar form (boxed in light red).
2. Quick Search be used to quickly retrieve experimental validation data and cancer analysis data.
3. Contents of RNADisease updates.
4. Other databases contributed by our group.
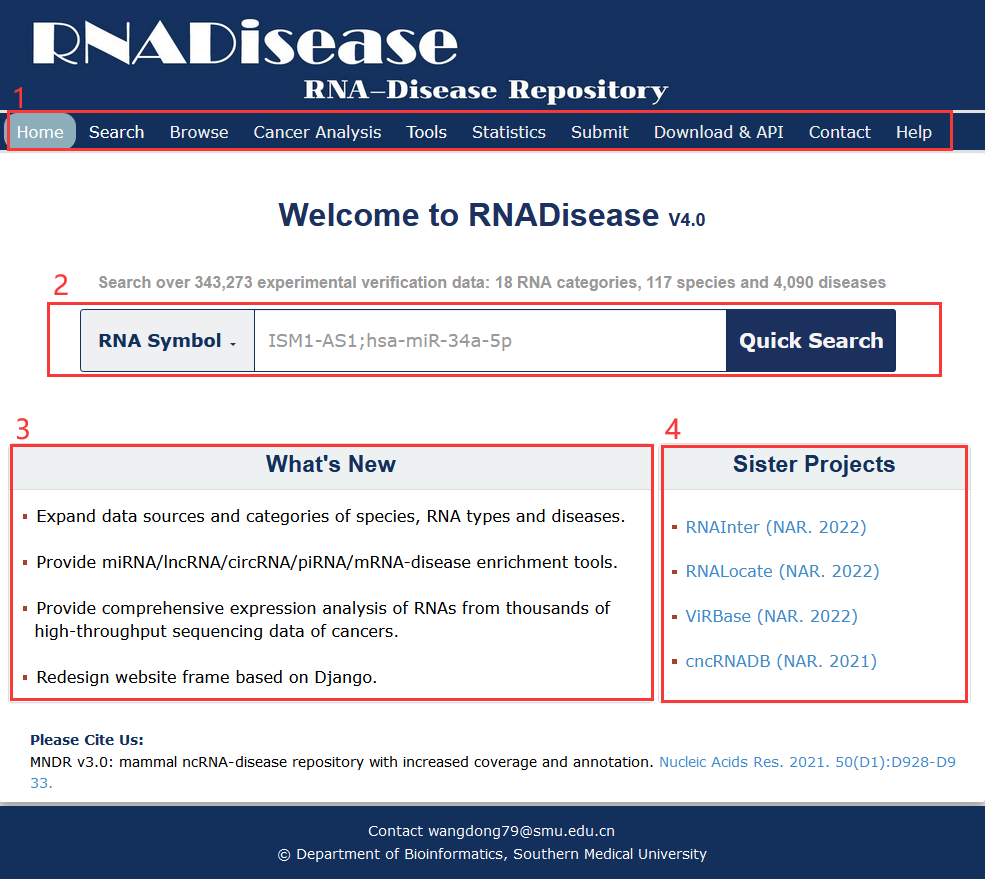
Fig 1-1 Homepage
The Exact search page is displayed in Fig 2-1:
1. Carefully select a dataset: Four choices are provided.
2. Enter a keyword corresponding to select dataset.
3. Five categories provided to filter results: Category, Species, Data Source, Experimental Method and Score.
4. Use NCBI Gene / miRBase / circBase / piRBase / NONCODE / Disease Ontology / MeSH to normalize your input information.
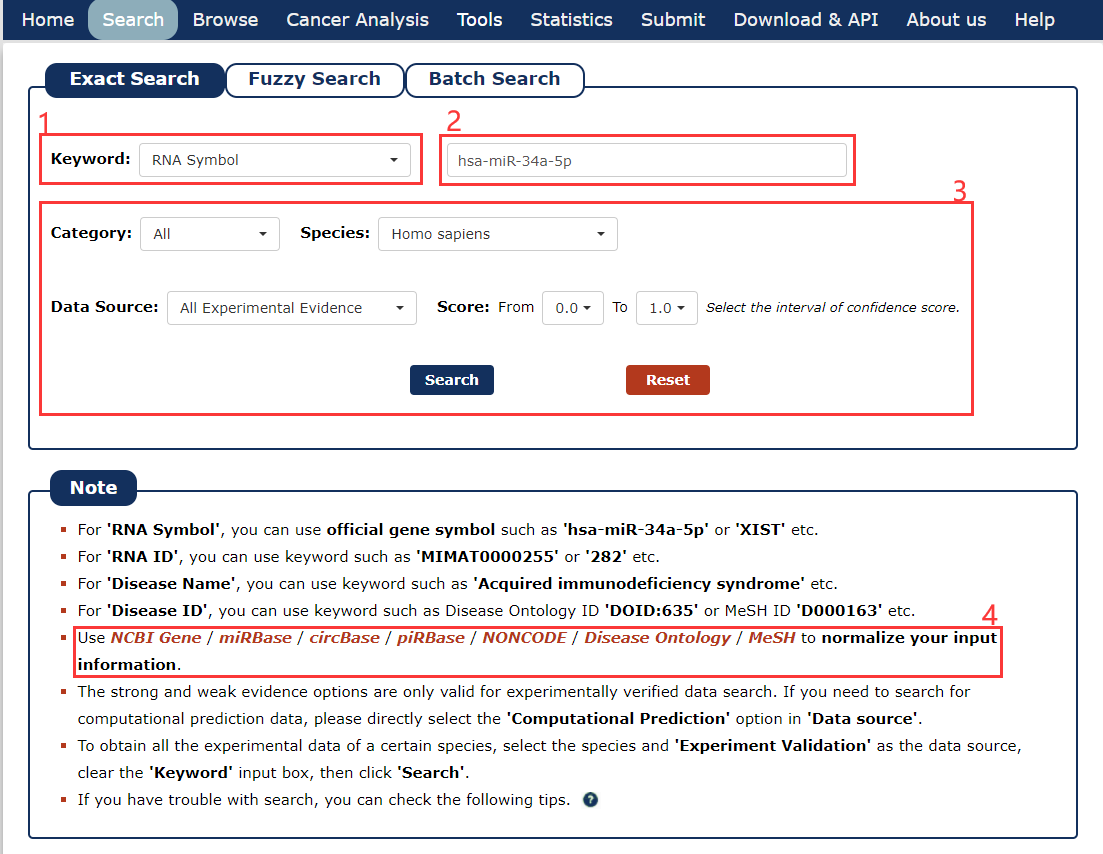
Fig 2-1 Exact Search page
The Fuzzy search page is displayed in Fig 2-2:
1. Select the category of your keyword.
2. Enter a keyword corresponding to select.
3. Choose the match entries what you want.
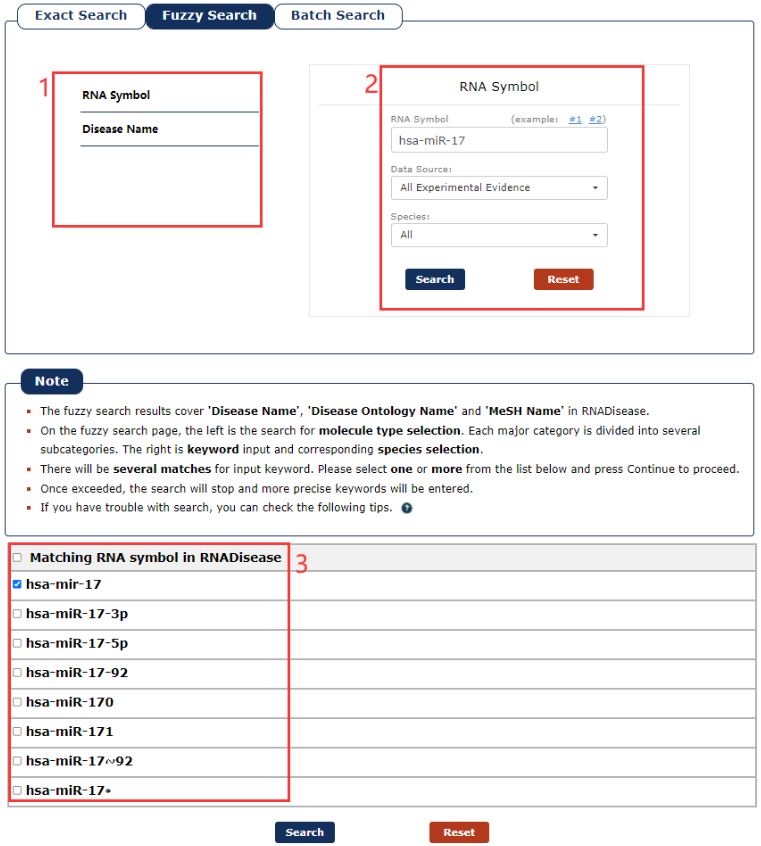
Fig 2-2 Fuzzy Search page
The Batch search page is displayed in Fig 2-3:
1. Select a dataset for your keywords.
2. Enter the keywords or upload a file.
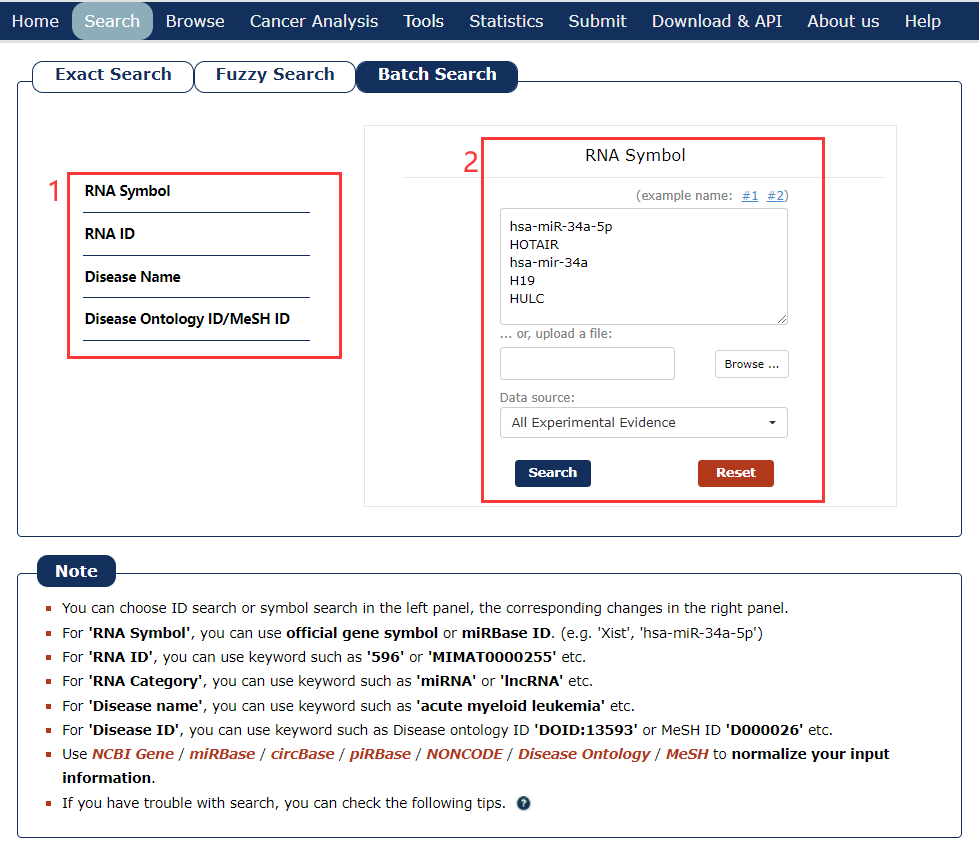
Fig 2-3 Batch Search page
This tutorial is as follows.
1. First we have to choose the type of keyword. There are four keyword types in our search as the picture shows. In this example, we choose ‘RNA Symbol’ as the keyword type.
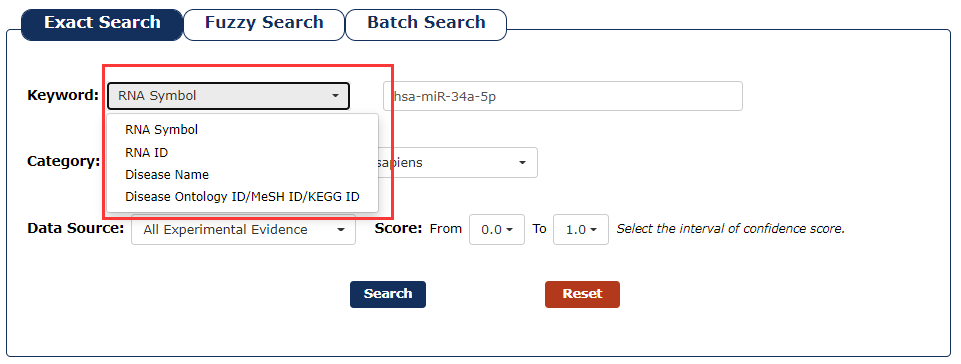
Fig 3-1
2. Next, we enter the keyword according to the keyword type selected in the previous step. In this example, we choose 'has-miR-34a-5p' as the keyword.
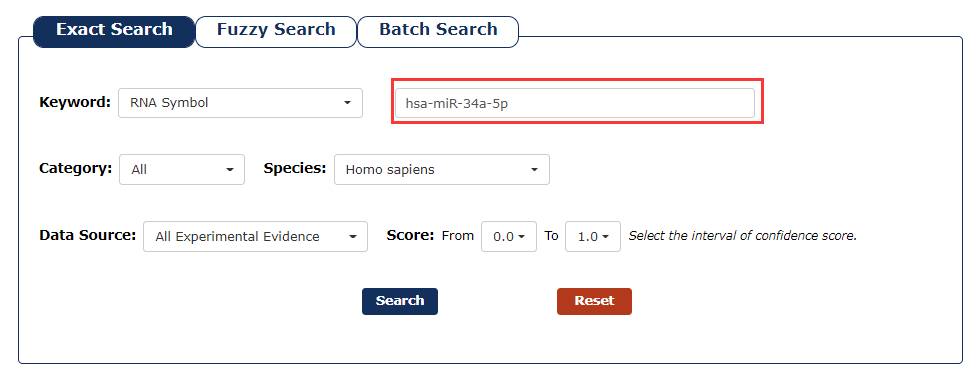
Fig 3-2
3. Then select the category for the keyword you entered. In this example, we choose 'miRNA' as the category of the keyword ‘has-miR-34a-5p’.
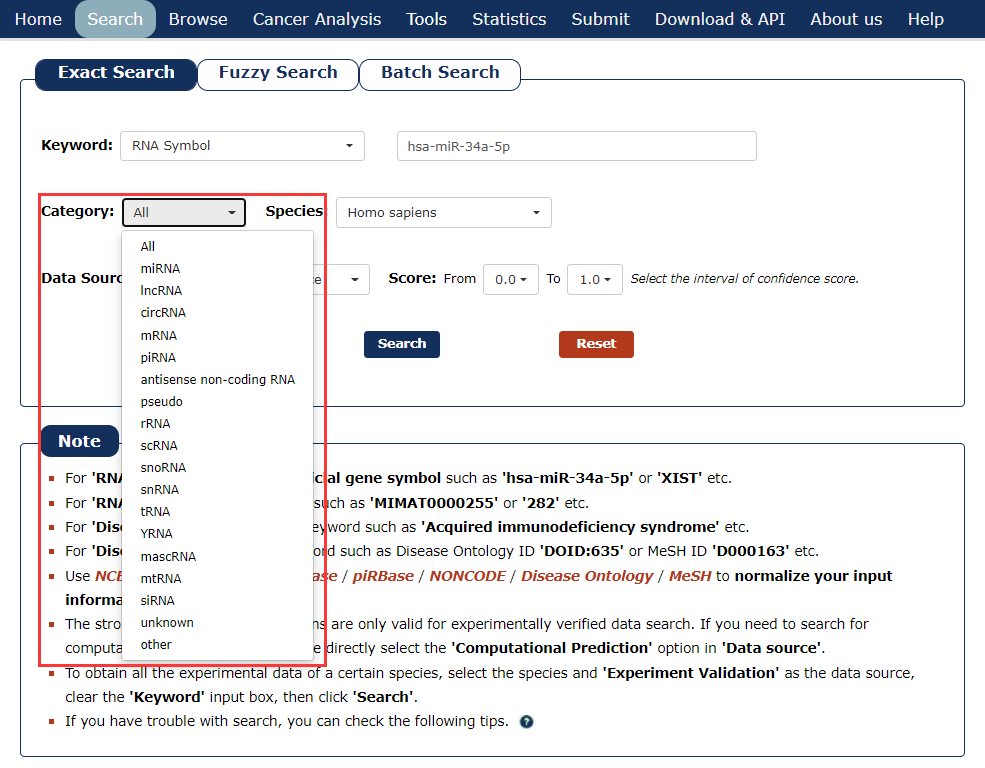
Fig 3-3
4. Then select the species for the keyword you entered. In this example, we choose 'Homo sapiens' as the species of the keyword ‘has-miR-34a-5p’.
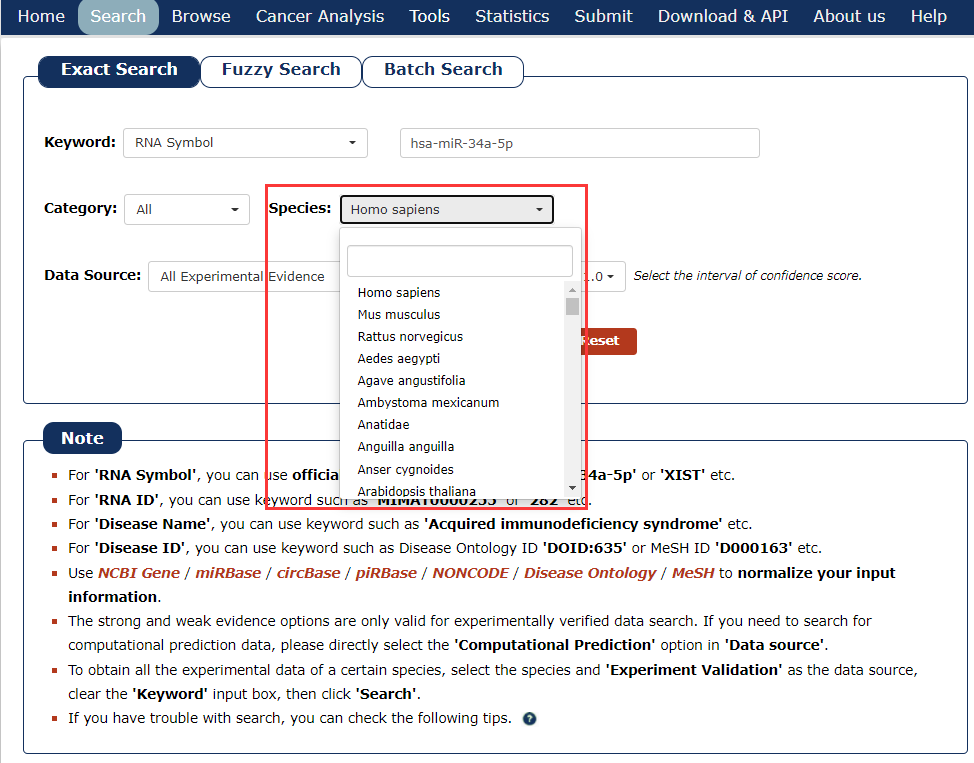
Fig 3-4
5. You can choose the type of data source as the filter. In this example, we want query the associations detected by experimental evidence, so we choose 'All Experiment Validation'.
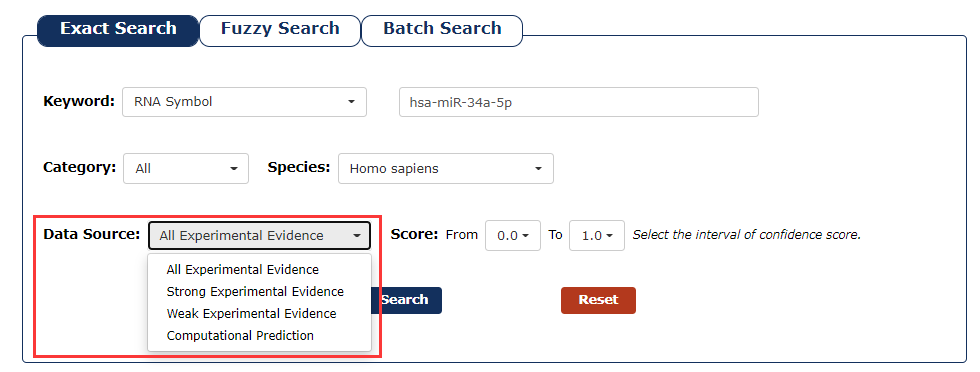
Fig 3-5
6. We provide a score for each association. The greater the value, the higher the credibility. To filter low-confidence associations, in this example, we choose the 0.5 as the minimum score and 1.0 as the maximum score.
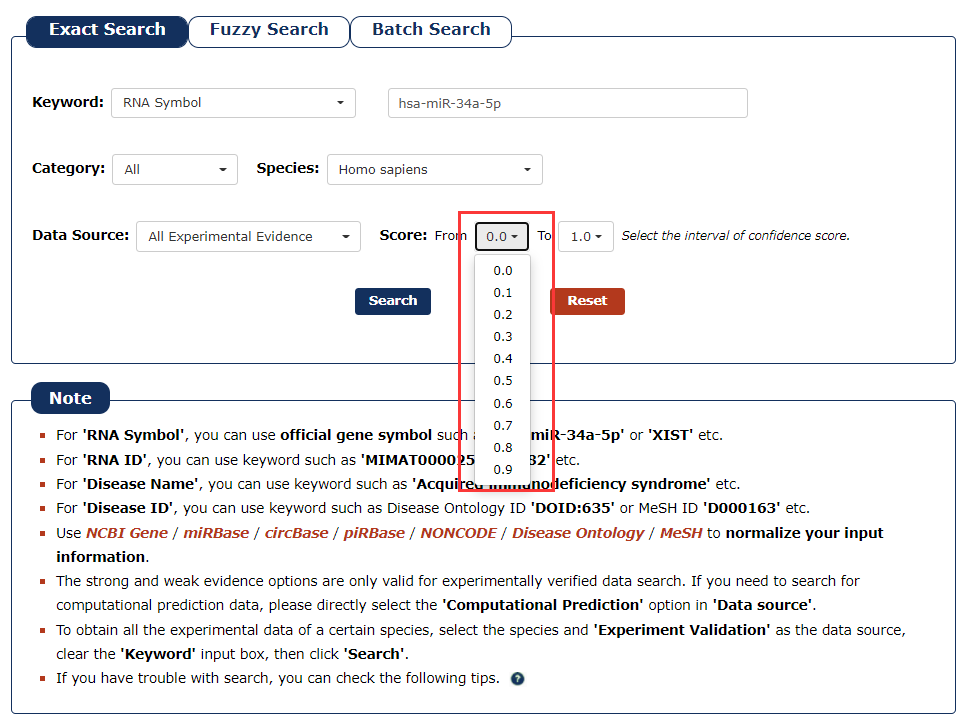
Fig 3-6
7. With all the filters above, we can click 'Search' to query the result.
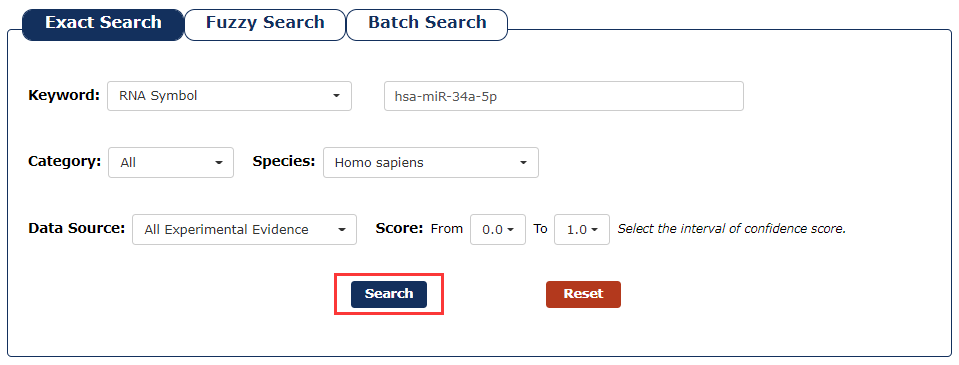
Fig 3-7
8. After several seconds, the result will occur. All the associations are represented in the table format, and your filters and the total numbers of associations are in the head of the web page.
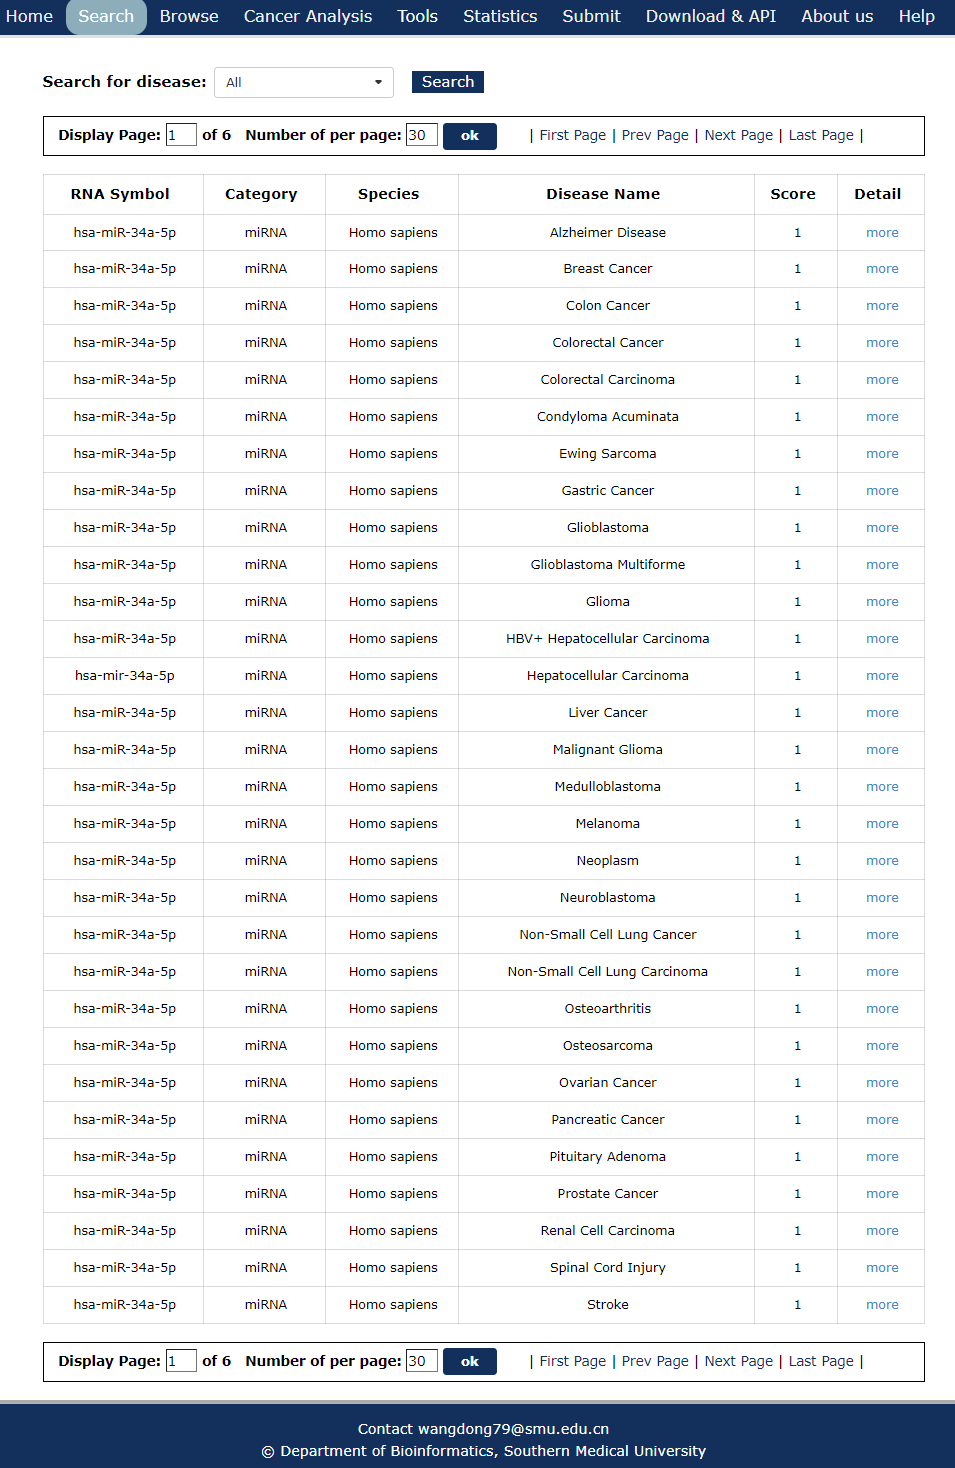
Fig 3-8
In the result page, all entries are listed with basic information including RNA symbols,RNA categories, diseases, species and score.
1. Search for disease or RNA on the results page.
2. Click to turn the page.
3. Choose a method to sort the search results.
4. Click to download the results page.
5. Click to link to detail page.
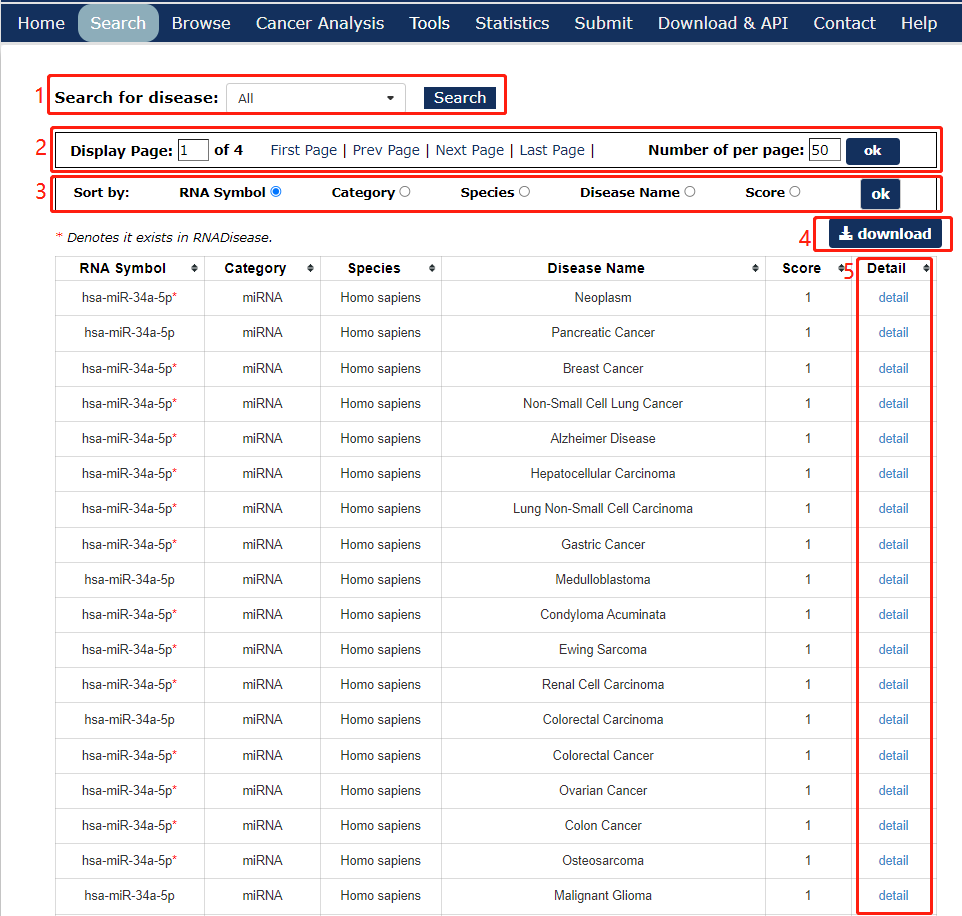
Fig 4-1 Search result page
In the detail page, you can get information including RNADisease ID, confidence score, RNA information, RNA interaction information, RNA localization information, RNA modification, disease information, related drug information, evidence support and references.
Fig 5-1:
For RNA-disease associations, users can choose any union of RNA and disease to see results.
We redesigned the RNADisease ID. Take RD-S-mi-303885 as an example, where 'RD' stands for RNADisease database, 'E' stands for data type of experimental verification, while 'P' stands for the prediction data. 'mi' stands for RNA type is miRNA, and similarly, 'lnc' stands for lncRNA,'m' stands for RNA type is mRNA,'circ' Stands for circRNA, 'pi' stands for piRNA, 'sno' stands for snoRNA,'t' stands for tRNA and 303885 stand for ID numbers.
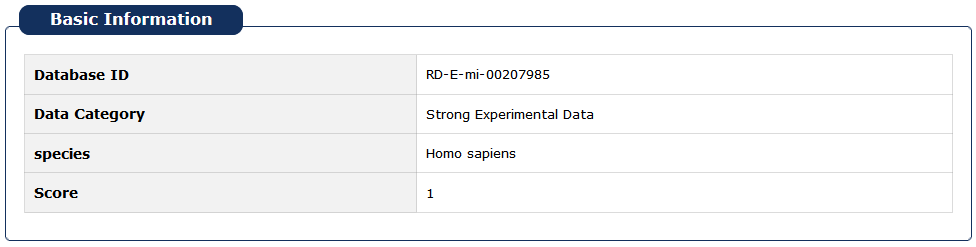
Fig 5-1 Detial page of basic information
Fig 5-2:
For RNA-disease associations, users can click EntreZ ID/miRBase Accession/circBase ID/piRbase ID to see its basic description in NCBI gene database/miRBase/circBase/piRBase/NONCODE.At the same time, we give the location information of miRNA/circRNA, the synonymies of lncRNA/mRNA/snoRNA.
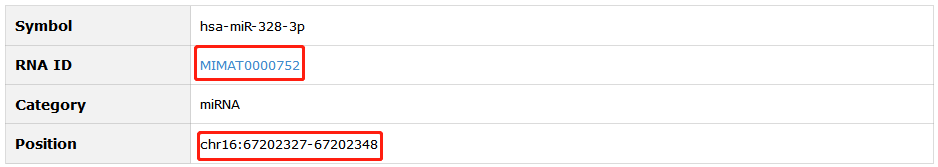
Fig 5-2 Detail page of RNA information
Fig 5-3:
1. Click any disease as a keyword to search in database.
2. Click Disease Ontology/MeSH/KEGG Disease ID to see its description in detail.
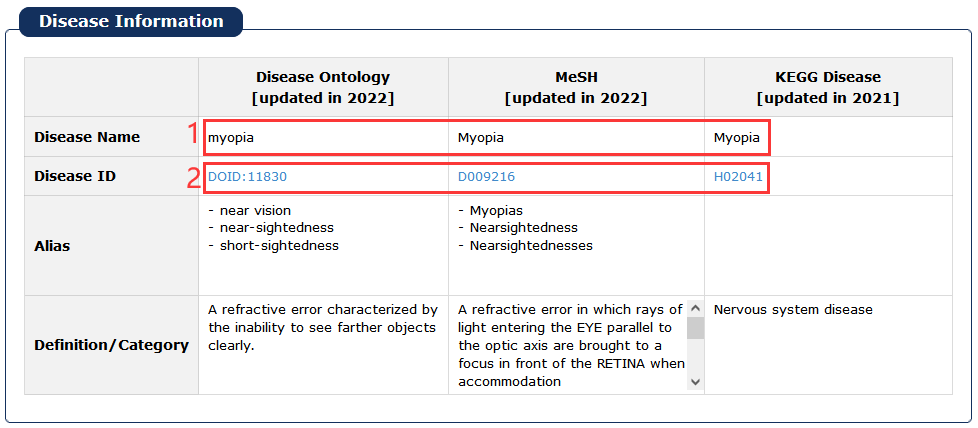
Fig 5-3 Detail page of disease information
Fig 5-4:
1. Related drug information from four sources is provided.
2. Four functions of RNA-Drug are demonstrated.
3. Click Link can see more information.
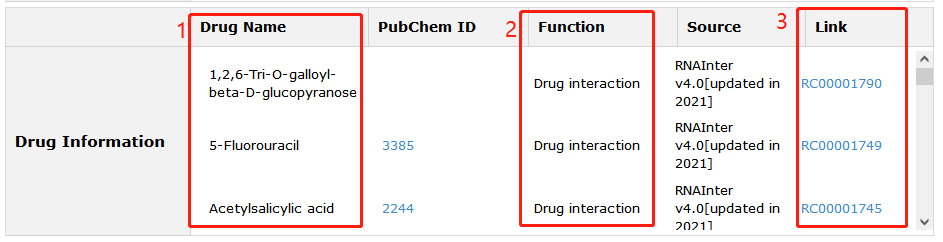
Fig 5-4 Detail page of drug information
Fig 5-5:
RNA interactions of each entry also in our database are provided. Click Link can see more information.
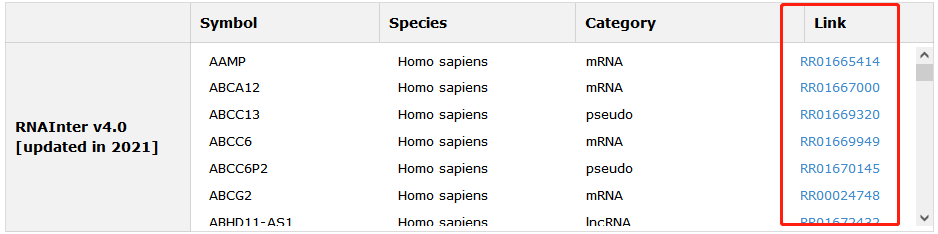
Fig 5-5 Detail page of RNA interaction information
Fig 5-6:
RNA locations of each entry also in our database are provided. Click Link can see more information.
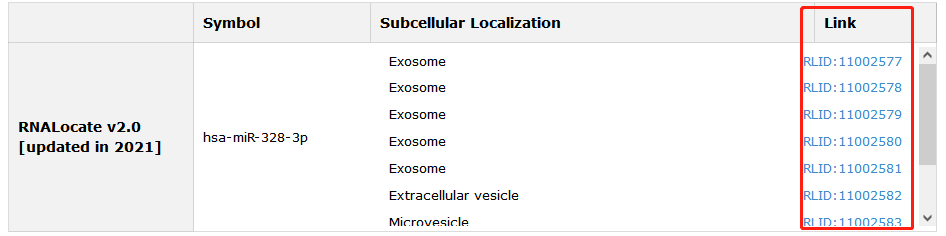
Fig 5-6 Detail page of RNA localization information
Fig 5-7:
1. Evidence Support including three parts: strong evidence, weak evidence and support database.
2. Click PubMed ID to see description in detail.
3. Tissue or cell line, target genes/RNAs and expression of each RNA.
4. Target genes of the RNA were manually curated from literatures.
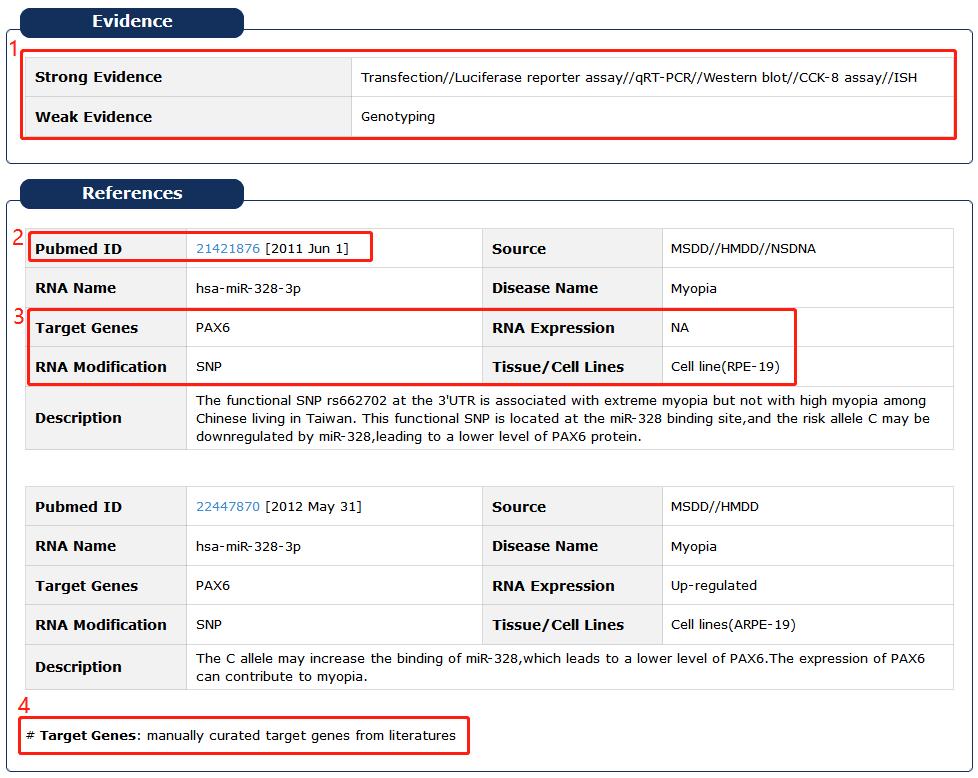
Fig 5-7 Detail page of evidence support and reference
Fig 5-8:
1. Name of predicted algorithm.
2. Score of predicted algorithm: scale the score of the prediction algorithm range 0 to 1, if the prediction score of this item is greater than 0.8, it is considered that RNA is more related to disease.
3. Principle of prediction algorithm.
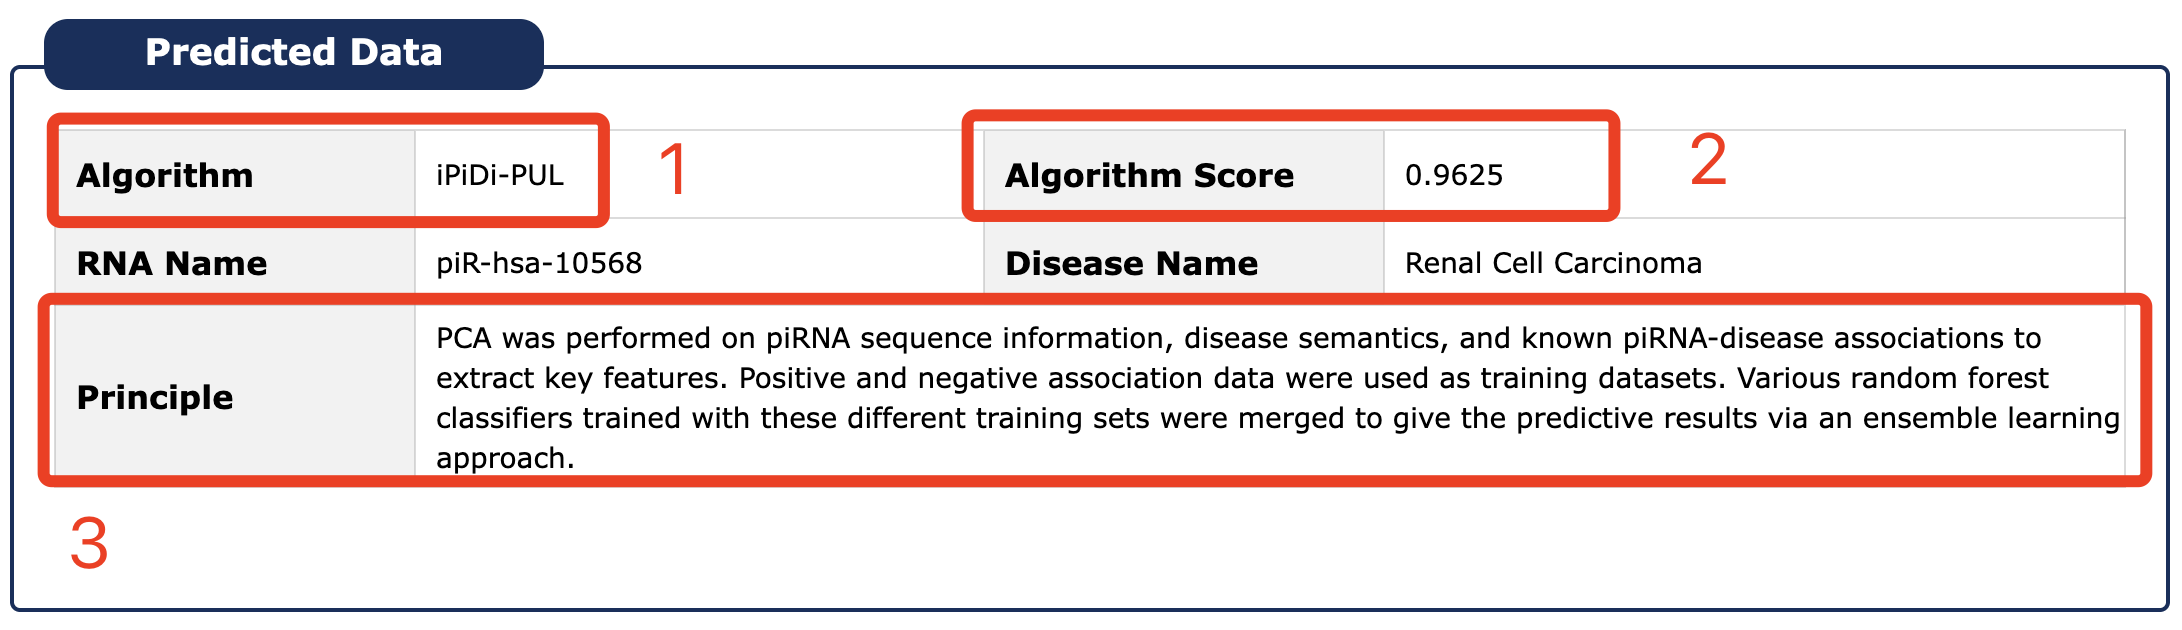
Fig 5-8 Detail page of predicted data
In the browse page, you can click each node to see results.
1. 'Diseases' display all entries as long as the current selected disease is involved.
2. 'RNA Category' indicates all kinds of RNA in RNADisease.
3. 'Species' display all entries as long as the organism matches the condition.
4. 'Prediction Algorithm' display all entries as long as the Algorithm matches the condition.
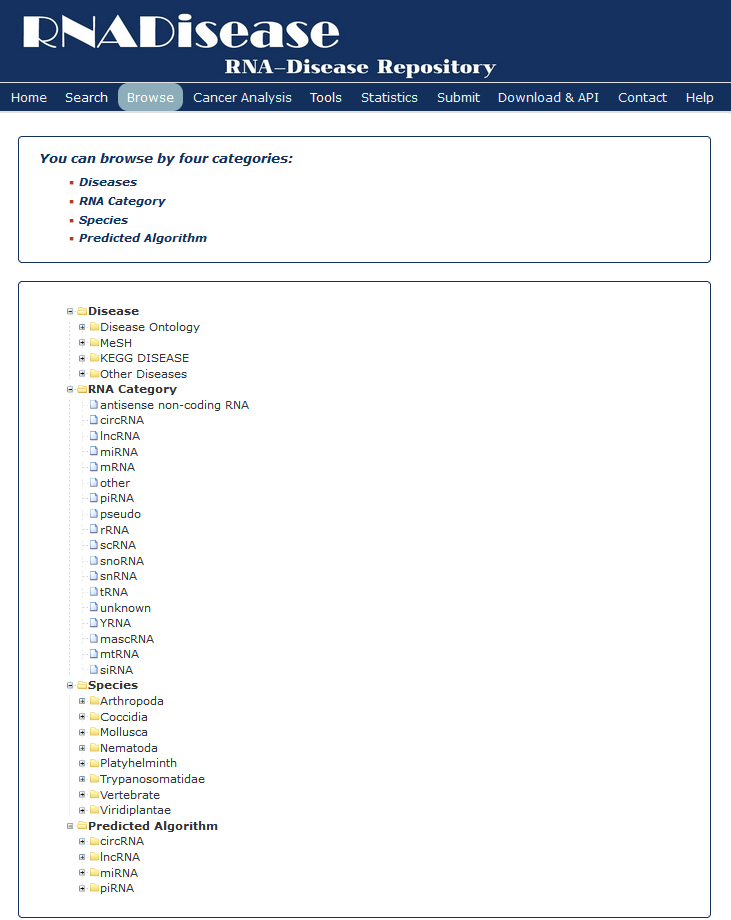
Fig 6-1 Browse page
'Cancer Analysis' performs comprehensive analysis and visualization of RNAseq/miRNAseq data for 44 cancer types in TCGA/ICGC/TARGET
1. RNADisease normalized the expression level by TPM.
2. RNADisease uses DESeq2/edgeR/Wilcoxon rank sum test to provied users the different kinds of RNA which differentially expressed or specific differentially expressed in cancers and set FDR (False Discovery Rate) value <= 0.05 as the threshold.
3. RNADisease performes functional enrichment analysis on differentially expressed mRNA/miRNAs(target genes predicted by miRWalk) and set FDR (False Discovery Rate) value <= 0.05 as the threshold.
4. RNADisease performes survival analysis on differentially expressed RNAs or top 200 RNAs with the highest expression levels in a cancer without normal control, using the survival R package and set a p-value <= 0.05 as the threshold to filter which RNAs were meaningful for patients' survival. RNADisease provides the survival KM curve plots for survival related RNAs.
Fig 7-1
1. Select a search method: three choices are provided.
2. Enter a keyword corresponding to the selected search method.
3. Select a differential expression analysis method.
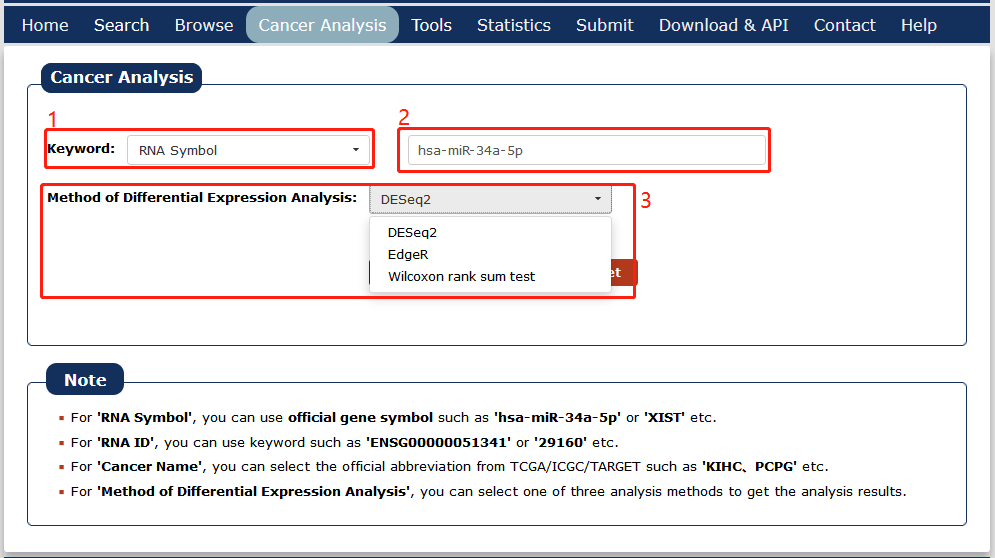
Fig 7-1 Cancer Analysis search page
Serach for RNA symbol/RNA ID(miRBase ID/EntreZ ID)
Fig 7-2:
1. RNA basic information, users can click EntreZ ID/miRBase accession to see its basic description in NCBI Gene database/miRBase.
2. RNA interactions of each entry also in our database are provided. Click 'Link' can see more information.
3. RNA locations of each entry also in our database are provided. Click 'Link' can see more information.
4. Related drug information from four sources is provided.
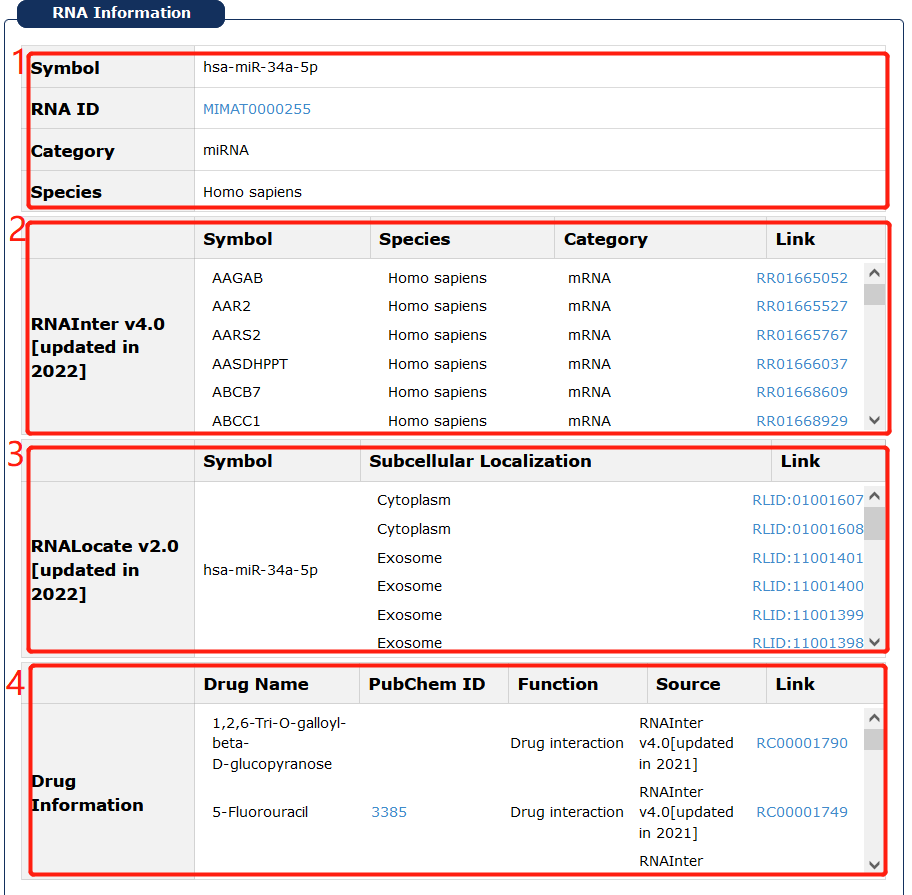
Fig 7-2: Basic RNA informations in 'Cancer Analysis' page
Fig 7-3:
Provide the average expression of mRNA/lncRNA/miRNA across all disease samples in cancers, users can move the cursor over the block to see the detailed expression level of the selected RNA, and click the block to jump to the corresponding cancer.
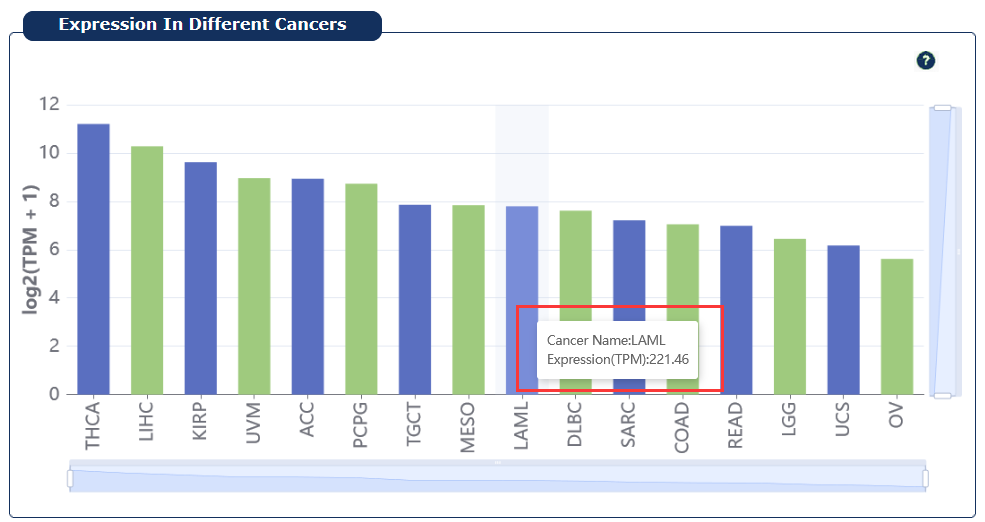
Fig 7-3:RNA expression in cancers plot page
Fig 7-4:
Provide the RNA which differentially expressed in cancers.
1. User can select one or more cancers.
2. Moving the cursor over the box plot will display the details.
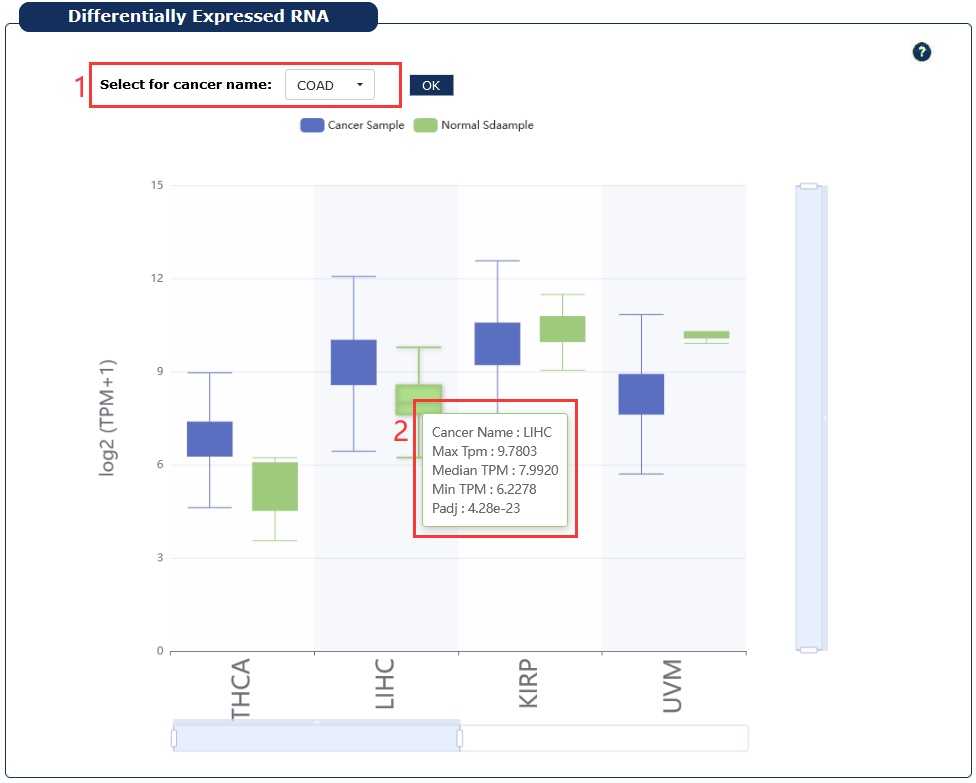
Fig 7-4:Differentially expressed RNA in cancers page
Fig 7-5:
RNADisease uses FDR (False Discovery Rate) value <= 0.05 as threshold to filter RNA which is significant to patients' survival,and provide the survival KM curve plot for survival related RNA.
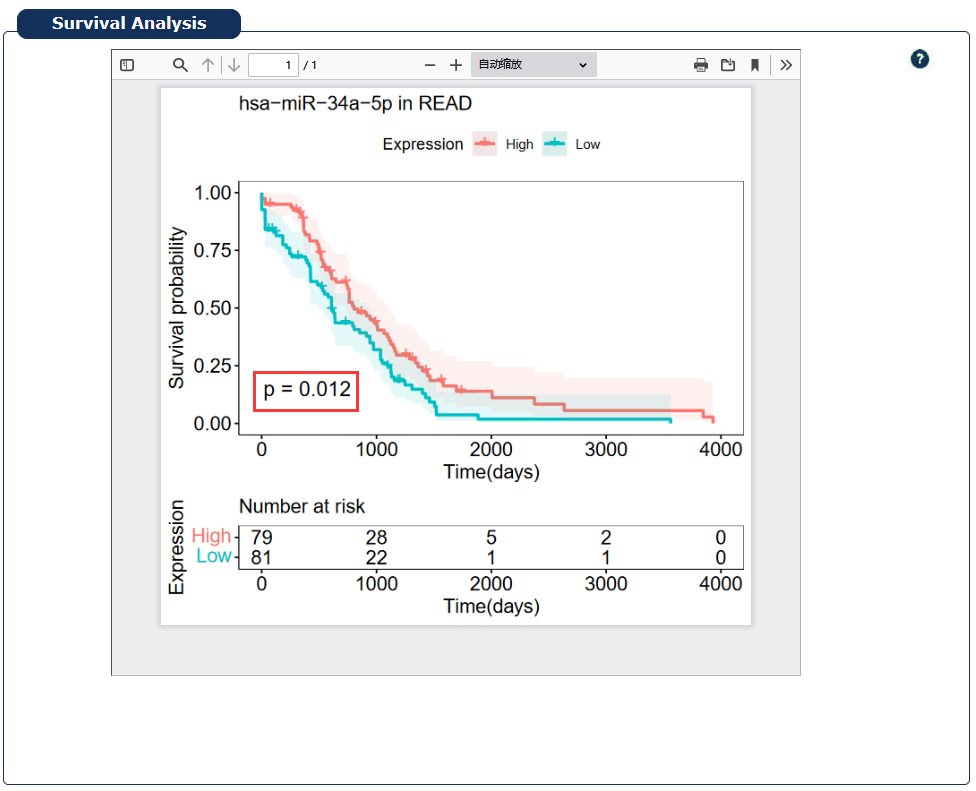
Fig 7-5:Survival analysis page
Serach for disease name(cancer abbreviation)
Fig 7-6:
1. Click any disease as a keyword to search in 'Cancer Analysis'.
2. Click Disease Ontology/MeSH/KEGG DISEASE ID to see its description in detail.
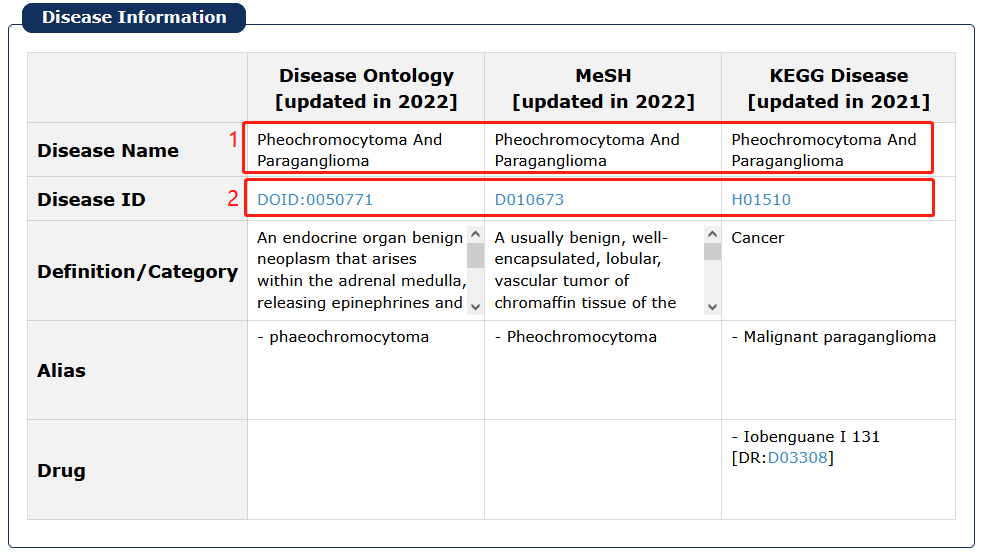
Fig 7-6:Basic cancer informations page
Fig 7-7:
1. Select a type of RNA
2. Select the number to display RNAs
3. Moving the cursor over the box plot will display the details
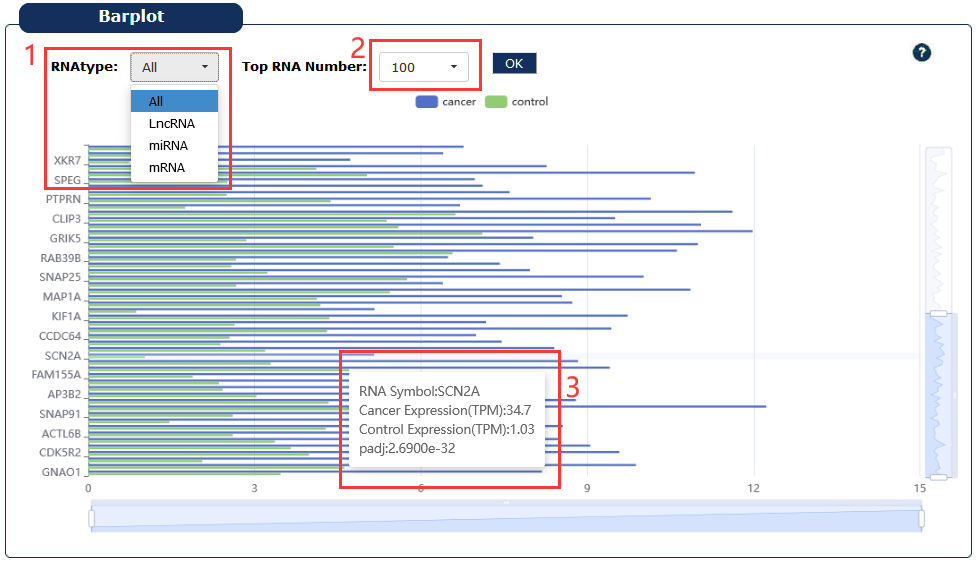
Fig 7-7:RNAs expression in cancer page
Fig 7-8:
1. Select a type of RNA
2. Moving the cursor over the box plot will display the details
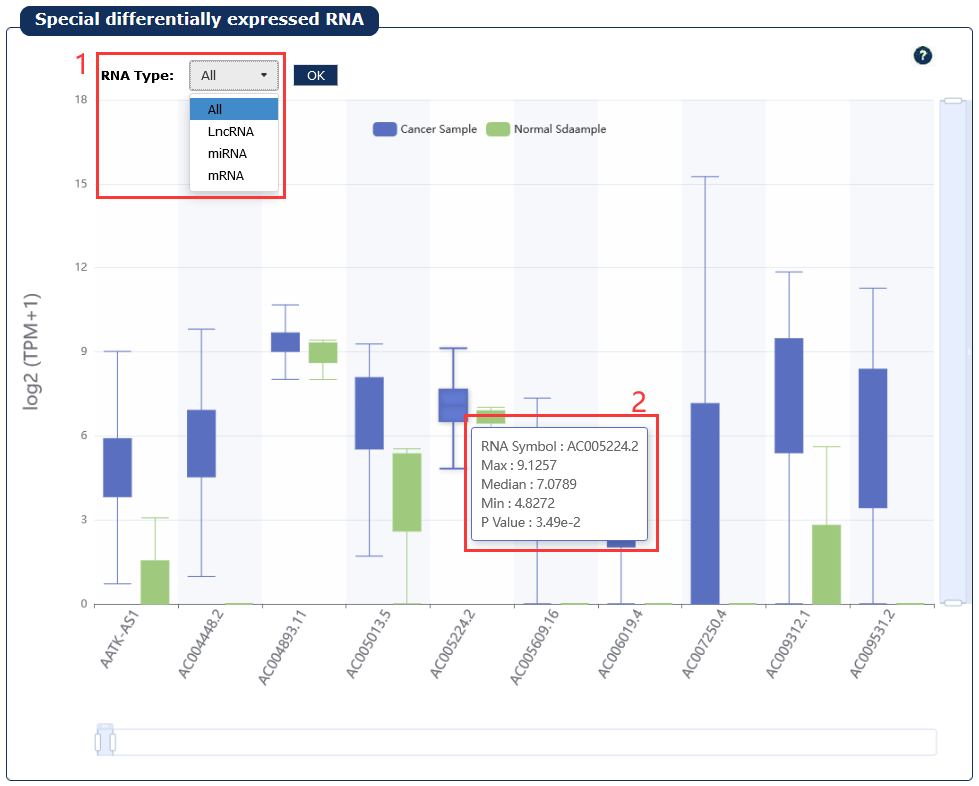
Fig 7-8:Specific differentially expressed RNAs in a certain cancer page
Fig 7-9:
We used the differentially expressed mRNAs and the target genes of differentially expressed miRNAs predicted by miRWalk to perform functional annotation and show some of the most significantly related pathways or functions, usually the top 20.
1. Select a kind of dataset.
2. Select a type of RNA.
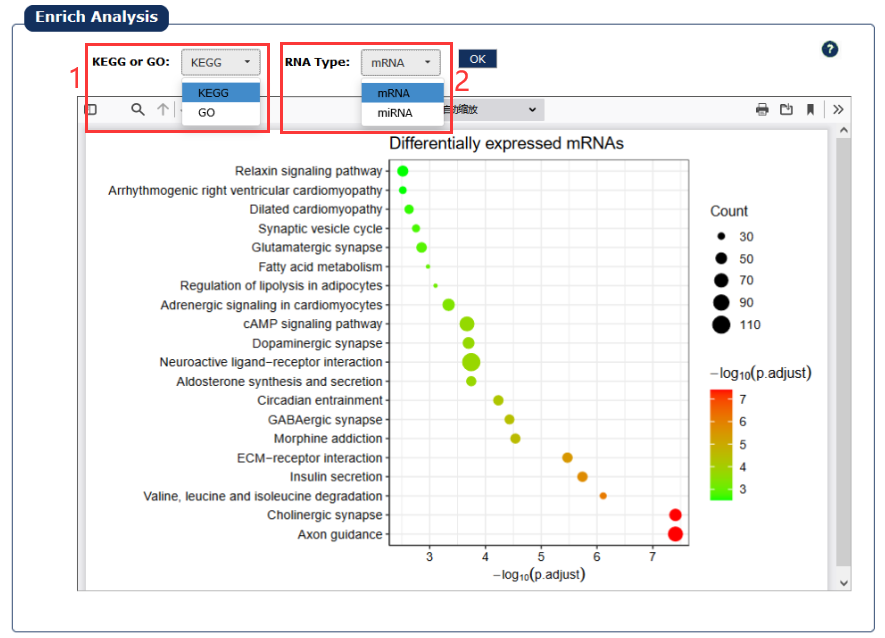
Fig 7-9:Functional enrichment analysis page
Fig 7-10:
1. Display overall survival for the cancer
2. Select a RNA symbol
3. Select a type of RNA
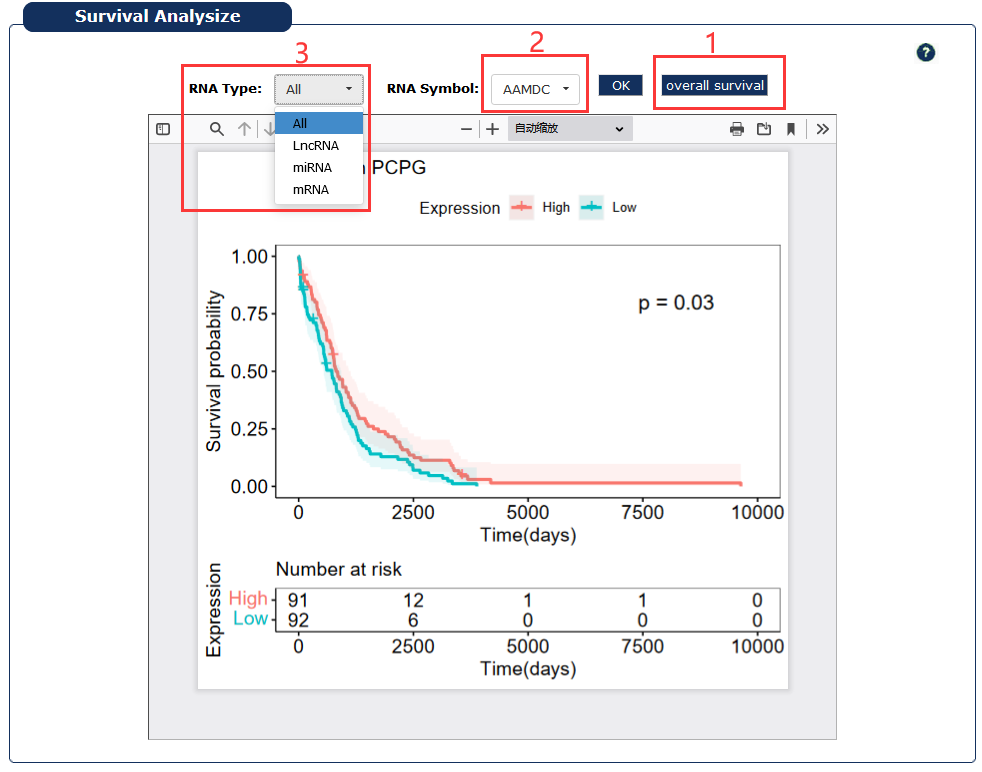
Fig 7-10:Survival analysis page
The Prediction Tool provides four ncRNA-disease predictions in our database, including miRNA-disease(MDNNMTF), lncRNA-disease(GMCLDA), circRNA-disease(CD-LNLP) and piRNA-disease(iPiDi-PUL).
Fig 8-1: Prediction tool page.
1. Choose RNA type and corresponding algorithm.
2. Directly input one or more miRNA/lncRNA/circRNA/piRNA sequences or upload a .fasta file with fasta format.
3. Choose how many results to display.
4. Display predicted results and support download.
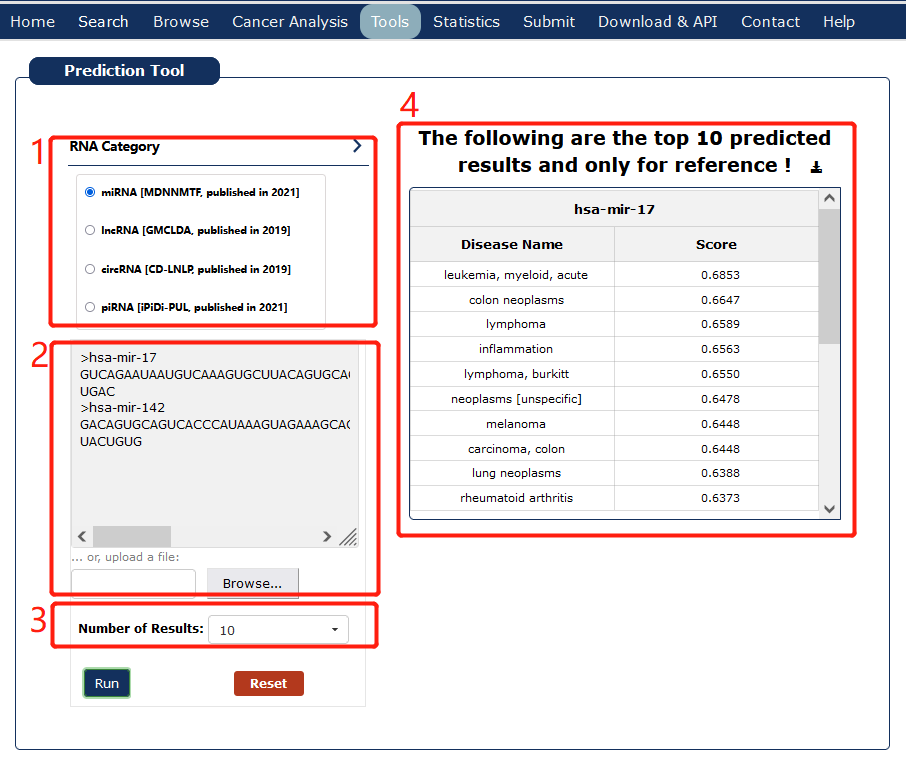
Fig 8-1 Prediction Tool page
The Disease Enrichment tools provide annotations of relevant diseases for a set of RNAs input by the user, and calculate the significance of enrichment analysis by hypergeometric test, finally provide some visualization results.
This tutorial is as follows.
1. Choose RNA type, 'ALL' means user can input any one or more RNA types of miRNA, lncRNA, circRNA.
2. Allow the users to input an interesting RNA Symbol or miRBase ID /circBase ID/NCBI Gene ID list or a text file.
3. Allow the users to set enrichment analysis conditions personally.
4. With all the conditions above, we can click 'Search' to return the result.
5. Return the RNA symbol list that matches the RNA set provided by the user in RNADisease.
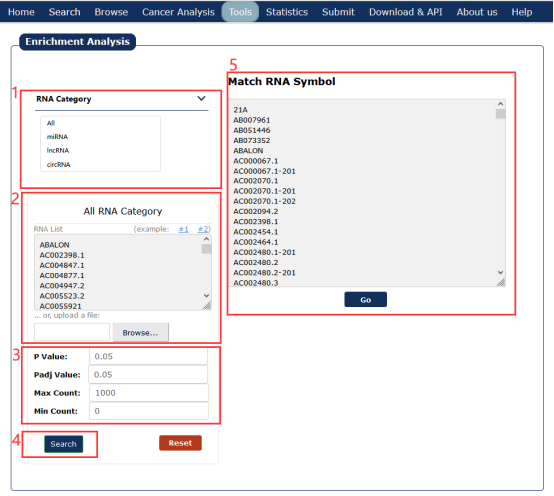
Fig 9-1 Disease enrichment analysis page
Fig 9-2:
1. Based on the RNA set with conditions provided by the user to obtain the relevant disease name.
2. 'Count' stands for the number of RNAs enriched in the disease,'number' stands for the number of RNAs that have been validated in the literature to be associated with the disease in RNADisease.
3. P value and Padj are obtained by hypergeometric test.
4. RNA symbols enriched in this disease
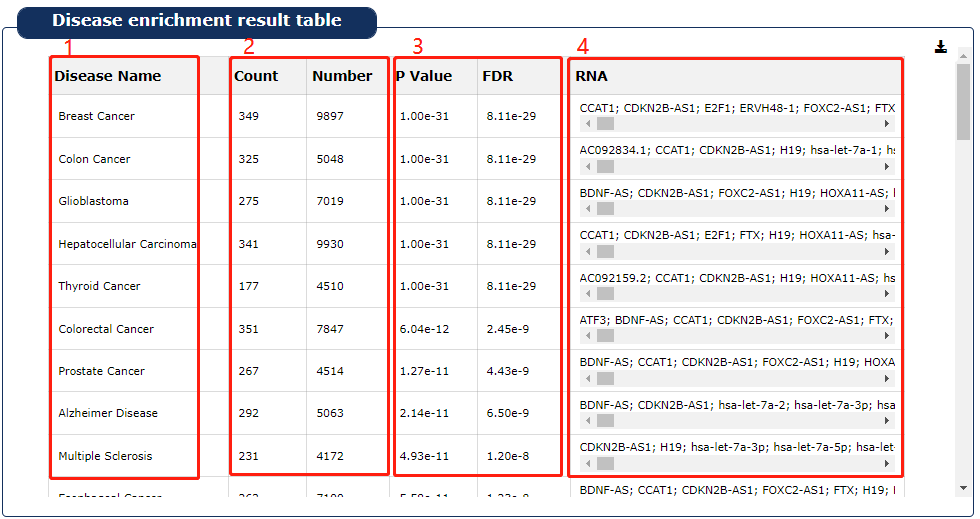
Fig 9-2 Disease enrichment result table
Fig 9-3:
1. The top 20 diseases are showed.
2. The plot can be adjusted via the legend.
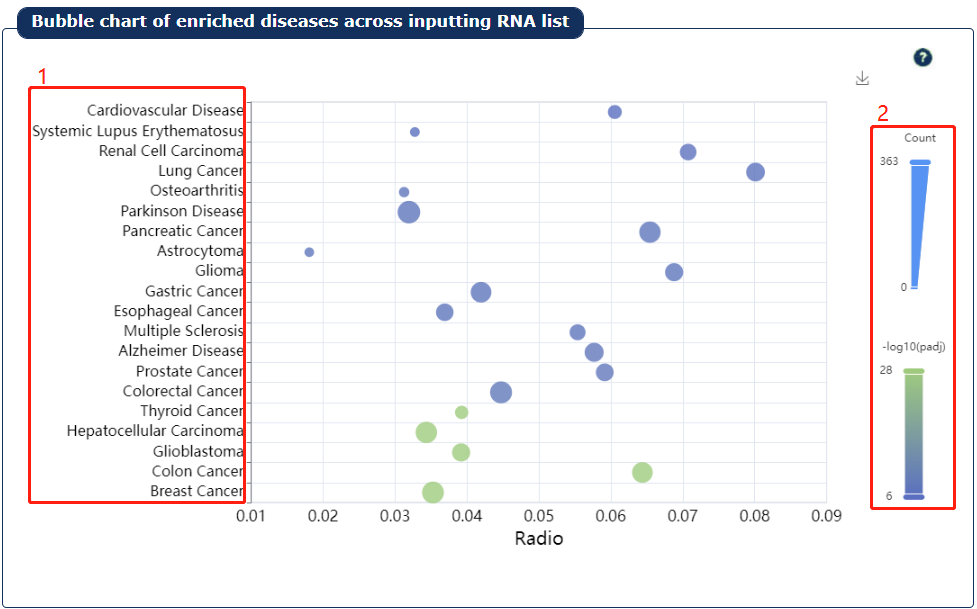
Fig 9-3:Disease enrichment result plot1
Fig 9-4:
1. The top 20 diseases are showed.
2. The legend shows the count and Padj of the disease enrichment analysis.
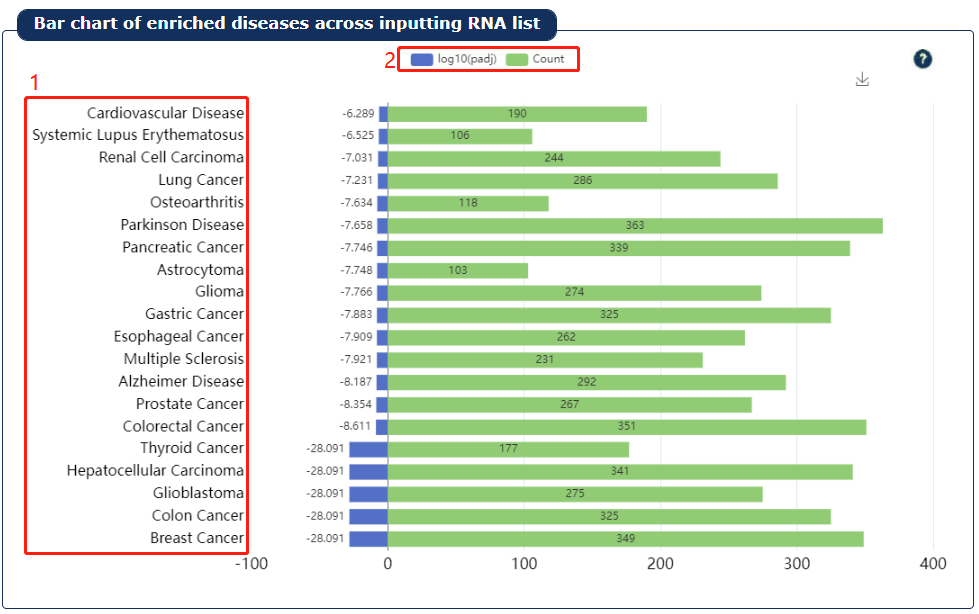
Fig 9-4:Disease enrichment result plot2
In RNADisease, the RNA-disease associations are collected from different types of resources under one common framework, including experimental and prediction evidence. In principle, we assume that:
1. Experimental evidence should contribute more important to the confidence score than prediction evidence;
2. Strong experimental evidence should provide more reliable evidence than weak experimental evidence;
3. RNA-disease associations supported by more evidence should be given significantly higher confidence scores than those supported by fewer evidence.
Similar to MNDR v3.0, according to the evidence types and number of evidence resources, we calculate the confidence score (S) for each RNA-disease association as follows:
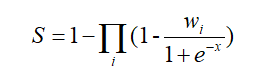
where i is the evidence type (s: strong experimental evidence, w: weak experimental evidence, p: computational prediction method), x is the number of evidence resources, we set weight factor Ws, Ww and Wp to 0.95, 0.45, and 0.1, respectively (if x=0, we set weight factor Wi to 0).
Integration of source databases which use different ncRNA, disease and drug naming conventions is challenging. To ensure maximal connectivity of data, we transform each ncRNA, disease and drug name found in the input sources to the appropriate naming convention.
1. For miRNA, we use miRBase ID and miRBase Accession.
2. For circRNA, we use circBase ID.
3. For mRNA/lncRNA, we use EntreZ ID.
4. For piRNA, we use piRBase Name and piRBase Accession.
5. For others, we use official Gene Symbol and Entrez ID.
6. For diseases, we normalized each disease name and ID according to Disease Ontology, MeSH and KEGG DISEASE.
7. For drugs, we use NCBI PubChem Compound symbol and CID.
8. For species, we normalized organism names according to NCBI Taxonomy Database.